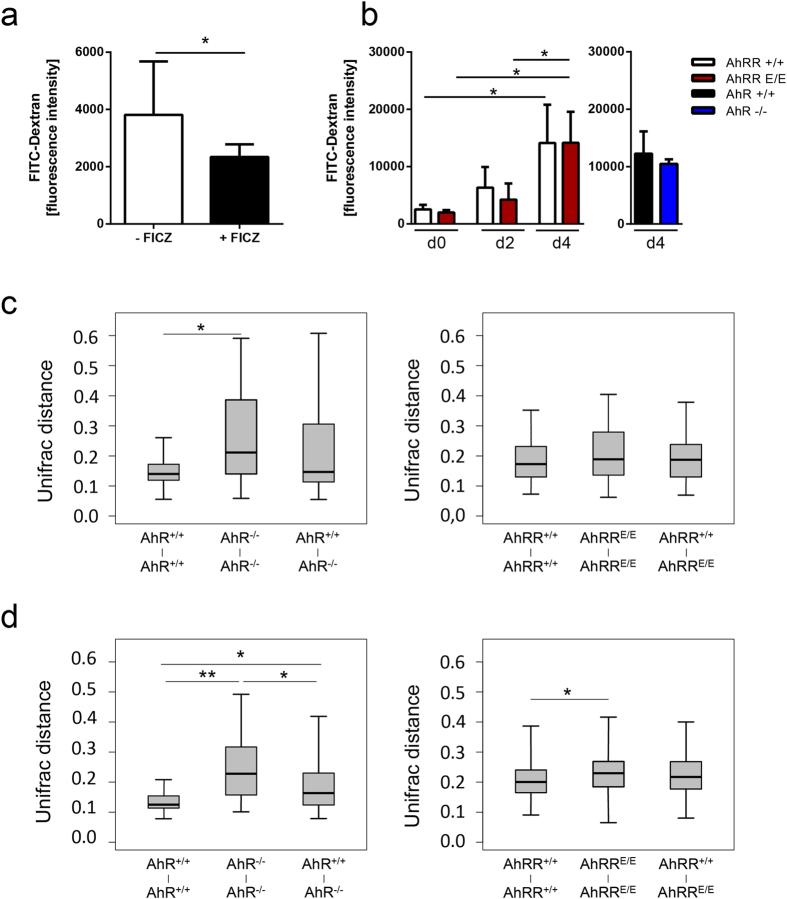
Figure 6. Intestinal permeability and composition of microbiota.
(a) Dependency of intestinal permeability on AhR activation. WT mice were left untreated or fed with FICZ 16 h before oral treatment with FITC-Dextran. The fluorescence intensity of FITC-Dextran in serum was determined 4 h later (n = 7–8), Data are shown as mean ± s.e.m. and significance was determined by students t-test p < 0.05 (b) AhRRE/E and AhRR+/+ littermates (left), were left untreated (d0, n = 3) or treated with 5% DSS for 2 (n = 3) or 4 days (n = 13, AhRR+/+ and AhRRE/E), and then fed with FITC-Dextran. AhR−/− and AhR+/+ littermates (n = 3, right) were treated with 5% DSS for 4 days and then fed with FITC-Dextran. 4 h later fluorescence intensity of FITC-Dextran was measured in serum. Data are shown as mean ± s.e.m.; significance was determined by two way ANOVA corrected for multiple comparisons by the Sidak method *p < 0.05 (AhRRE/E vs WT). (c,d) Variability of intestinal microbiota in the small intestine (c) and colon (d). Stool samples were collected from the ileum and 16S rDNA was amplified from bacterial DNA and subsequently sequenced using the Ion Torrent PGMTM system. Weighted unifrac distance analysis was performed using the operational taxonomic unit (OTU) information by FastUnifrac as described in Materials and Methods, n = 15 mice/group for AhRR+/+ and AhRRE/E littermates and n = 8 for AhR+/+ and AhR−/− littermates, Data are shown as mean ± s.d. and significance was determined by Wilcoxon’s rank sum test *p < 0,01 and **p < 1e-5.

