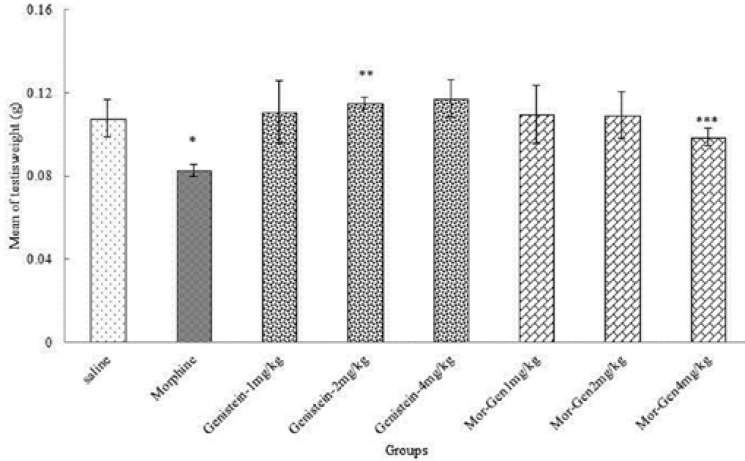
Figure 1.
Correlation analysis between treatment groups (morphine, Genistein and Genistein plus morphine) in Balb/c mice and testis weight. * Significant decrease of testis weight in morphine group compared to saline group (p=0.00). ** Significant increase in all groups compared to morphine group (p=0.00). *** Significant increase in all groups compared to morphine group (p=0.028

