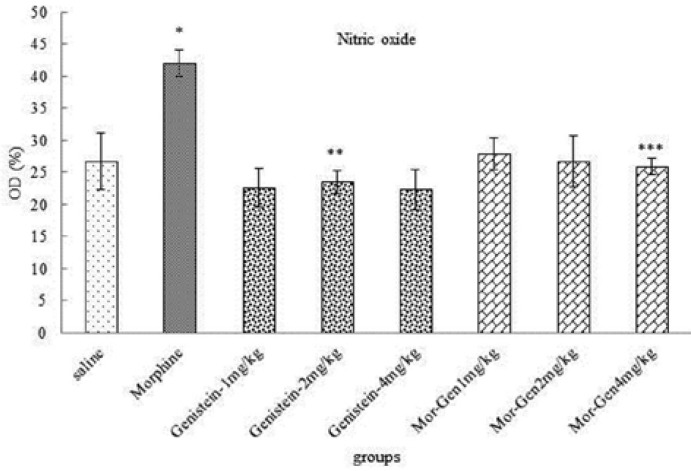
Figure 3.
Correlation analysis between treatment groups (morphine, Genistein and Genistein plus morphine) in Balb/c mice and Nitric oxide in blood serum. *Significant increase in morphine group compared to saline group (p=0.00). ** Significant decrease in all groups compared to morphine group (p=0.00). *** Significant decrease in all groups compared to morphine group (p= 0.00

