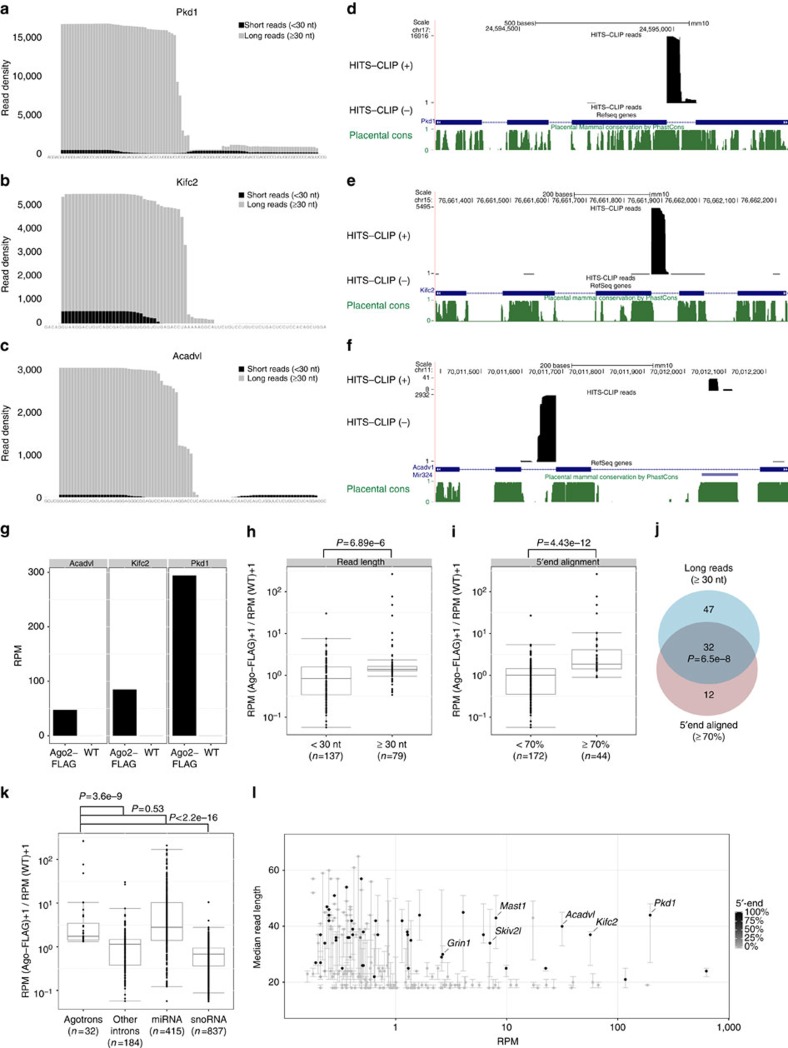
Figure 1. Ago2 HITS-CLIP analysis of short introns.
(a–c) Based on Ago2 HITS-CLIP (Tan et al.9); stacked density plots of putative agotron, Pkd1 (chr17:24594977-24595071(+), mm10) (a), Kifc2 (chr15:76661872-76661945(+), mm10) (b) and Acadvl (chr11:70011598-70011683(−), mm10) (c), respectively, with reads divided into long (≥30 nt, grey) or short (<30 nt, black). UCSC screendump of selected introns, Pkd1 (d), Kifc2 (e) and Acadvl (f) including the flanking regions, with HITS-CLIP read density (black) where (+) and (−) reflect the read direction, exon–intron annotation (blue) and placental phastcons conservation score profile (green). (g) Number of reads mapping to selected agotrons, Acadvl, Kifc2 and Pkd1 (as indicated), from Ago2 HITS-CLIP with Flag-tagged Ago2 expression (Ago2-FLAG) or WT. Boxplot of FLAG-Ago enrichment calculated as log2 (RPM in FLAG-Ago HITS-CLIP/RPM in WT HITS-CLIP) of intronic region with median read length ≥30 nt or <30 nt (h) or with fraction of 5′-end aligned reads ≥70% or <70% (i). P-values are calculated using Wilcoxon rank-sum test. (j) Venn diagram depicting the intersection between introns with long read length (n=79) and high 5′-end alignment (n=44) out of all the expressed introns (read count ≥20, n=216). P-value is calculated using χ2-test. (k) Boxplot of FLAG-Ago enrichment (as in h and i) of agotron, other introns, miRNAs and small nucleolar RNAs (snoRNAs). P-values are calculated using Wilcoxon rank-sum test. (l) All short annotated introns between 40 and 150 nucleotides (from UCSC gene annotation, mm10) are plotted as median read length by read count. Only introns with at least 20 counts are shown. The points are colour scaled according to the percentage of reads aligning to the 5′-end of the intron. Error bars reflect 5 and 95 percentiles.

