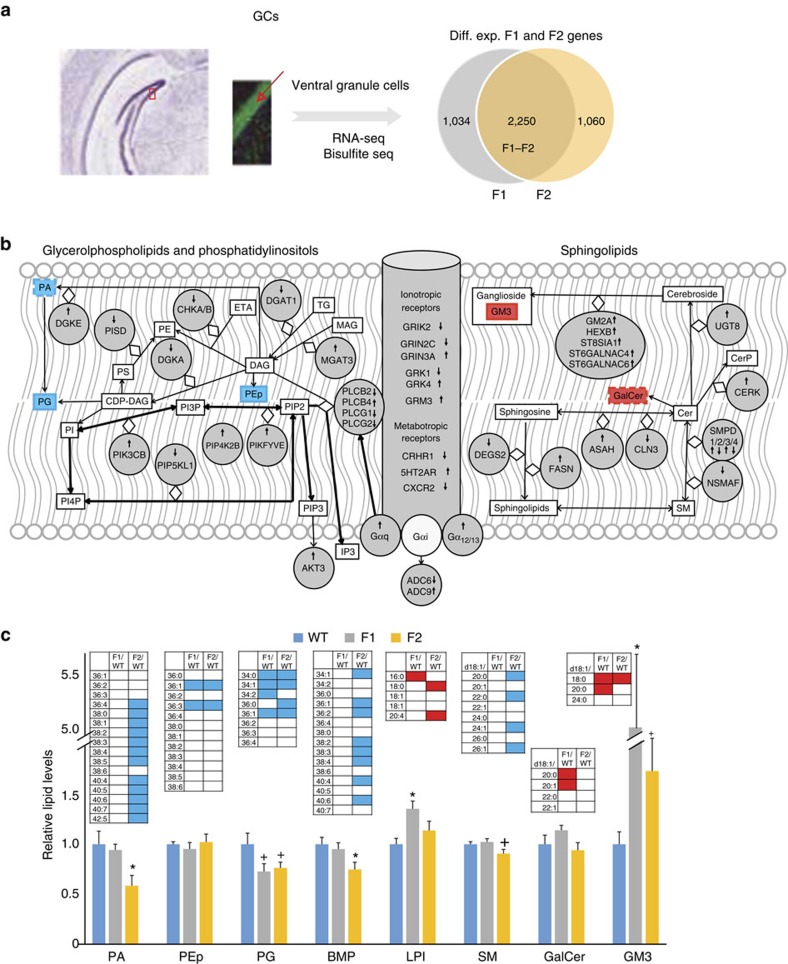
Figure 4. The impact of the receptor-deficient maternal environment on the F1/F2 neuronal transcriptome and metabolome.
(a) A sagittal section of the ventral hippocampus highlighting the location of ventral granule cells, the source of mRNAs and metabolites. Granule cells can be isolated as a homogenous population because of their clustering in the granule cell layer (cells are highlighted by their green NeuN-positive nuclei). Only a few cells positive for the glia marker glial fibrillary acidic protein (GFAP) present within the granule cell layer (blue cytoplasmic staining). Most of the differentially expressed F1 and F2 genes overlap. (b) Ingenuity functional analysis of differentially expressed overlapping F1–F2 genes identified enrichment in functions related to sphingolipid metabolism (right), receptor signalling (centre) and glycerophospholipids (left), indicated by solid grey circles, as a result of the maternal effect. Gene/protein nomenclature, see Supplementary Table 2. Lipid changes shown in c are also highlighted (blue box represents reduced and red increased levels in both F1/F2 granule cells, whereas red/blue boxes with staggered outline represent changes in either F1 or F2. Cer, ceramide; DAG, diacylglycerol; ETA, ethanolamine; GalCer, galactosylceramide, GM3, monosialodihexosylganglioside; MAG, monoacylglycerol; PA, phosphatidic acid; PE, phosphatidylethanolamine, PEp, plasmalogen phosphatidylethanolamine; PG, phosphatidylglycerol; PI, phosphatidylinositol; PS, phosphatidylserine; SM, sphingomyelin. (c) Glycerophospholipid and sphingolipid composition of F1 and F2 ventral granule cells, relative to WT cells. BMP, bis(monoacylglycero)phosphate; LPI, lysophosphatidylinositol. N=6 per group. Columns represent total levels of lipid subclasses. Results are presented as mean and bars as s.e.m, *P≤0.05; and trend +P≤0.1 by analysis of variance with Bonferroni post hoc test (α: 0.0166). Blue and red boxes in insets represent significantly reduced and increased levels in specific lipid species within lipid subclasses; see also Supplementary Table 4 for the extent of changes.

