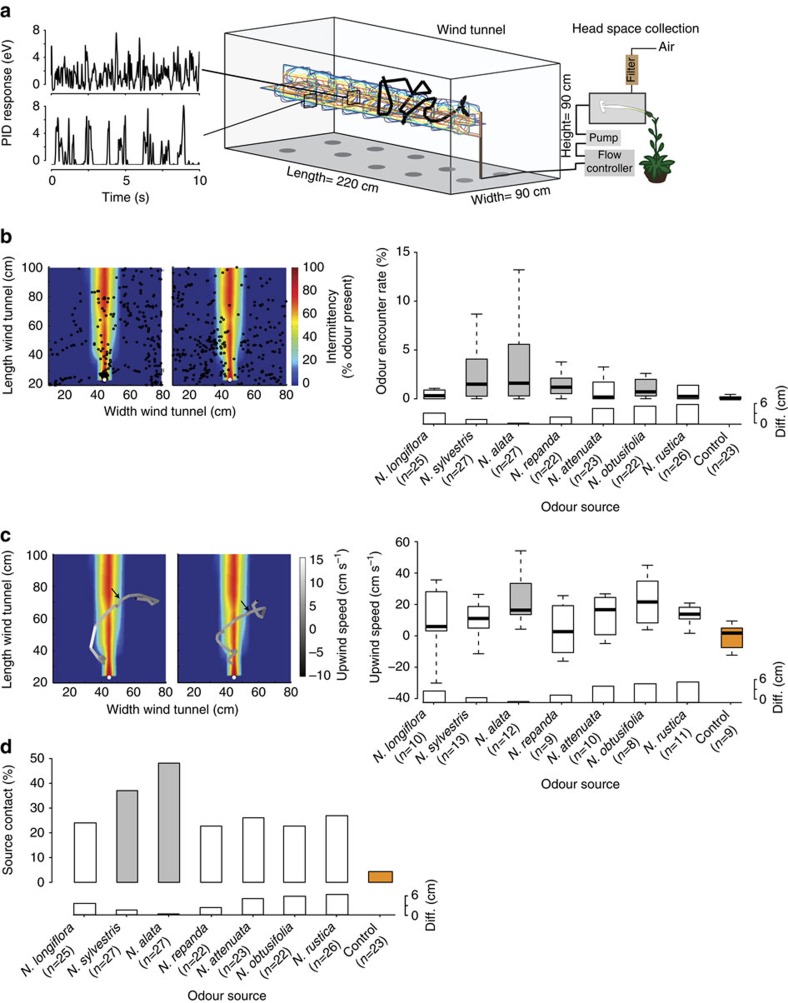
Figure 2. Behavioural responses of Manduca sexta towards headspaces of different Nicotiana flowers.
(a) Experimental set-up. Bold black line, example trace of a moth approaching the odour source; coloured pattern in tunnel, representation of odour intermittency within a plume as derived from Photo-Ionization Detector (PID) measurements. Left: PID recordings in central (top panel) and peripheral (lower panel) positions of the plume. Each amplitude denotes a filament. (b) Moth's encounter rate with odour plumes of different Nicotiana species. Few but long filaments at source result in a high odour encounter rate (% of time the moth encounters the odour at a specific location in the wind tunnel) as well as short, but many filaments downstream of the source. Grey boxes, P<0.05 to no-flower control (Kruskal–Wallis test (P<0.0001) followed by corrected Wilcoxon test). Outliers not shown. Bar plots above flower names indicate absolute differences between corolla length and the moth proboscis (cm) as shown in Fig. 1. Left panel: example flight recordings with N. alata (left) and N. obtusifolia (right) as stimuli, superimposed on the reconstructed odour plume. Black circles represent the last 400 individual tracking events (tracking rate 10 Hz) of two individual flights. Colours indicate the intermittency (that is, the per cent of time odour was measured at that position in the tunnel). Light grey dots indicate position of the odour source. (c) Median upwind speed during 0.5 s after first contact with odour plume. Grey boxes, P<0.05 to no-flower control (Kruskal–Wallis test (P<0.0001) followed by corrected Wilcoxon test). Grey boxes, P<0.05 to no-flower control (Kruskal–Wallis test (P=0.0432) followed by corrected Wilcoxon test). Outliers not shown. Bar plot as above. Left panels: example flight tracks (N. alata (left) and N. attenuata (right) as stimuli) reconstructed from individual tracking events similar to those shown in b 1 s before to 2 s after plume encounter. Flight tracks are superimposed on the reconstructed odour plume. Black–white colour scale indicates upwind speed of moth (cm s−1). Heat map as above. Black arrow indicates the point of first plume contact. (d) Mean per cent of source contacts when different flower headspaces were provided. Grey colour, P<0.05 to no-flower control (Bonferroni-corrected Fisher's exact test).

