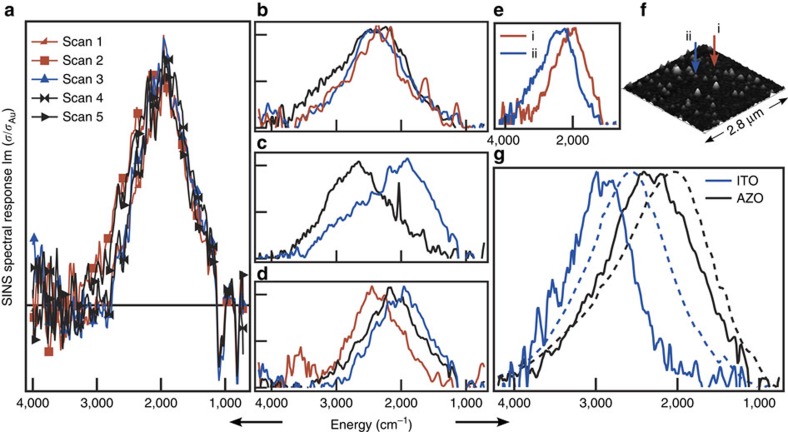
Figure 2. Heterogeneity observed by single nanocrystal spectroscopy of AZO.
(a) Repeated scans of an individual nanocrystal reproduce the same spectrum. A horizontal line at zero is included. Variations among nanocrystals were observed in (b) linewidth, (c) peak asymmetry and (d) peak energy. The eight spectra shown in b–d are each an average of several scans of an individual nanocrystal. Single nanocrystal spectra (e) are correlated with topographic information from AFM (f). (g) The sums of all collected single nanocrystal spectra (solid lines) form pseudo-ensembles for comparison to ensemble spectra measured by conventional transmission FTIR of thin films on KBr substrates (dashed lines) for both AZO and ITO.

