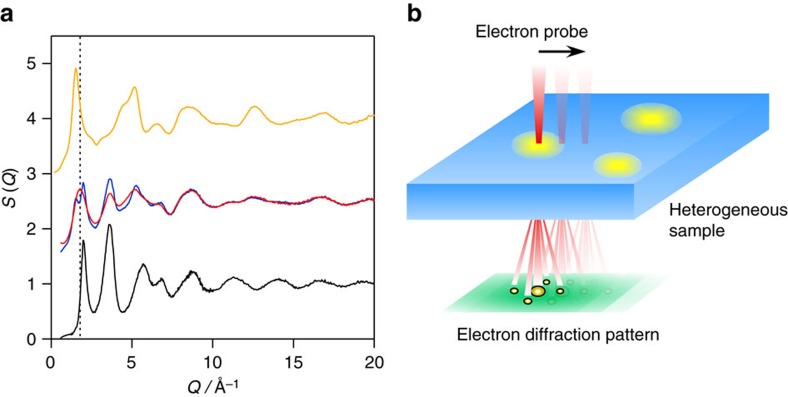
Figure 1. HEXRD and ABED experiments of amorphous SiO.
(a) X-ray total structure factors S(Q) of amorphous SiO, Si and SiO2. The X-ray S(Q) of amorphous SiO obtained from HEXRD (red) is shown together with the S(Q) data of amorphous Si (black) and SiO2 (orange) reported in the refs 15 and 1919, respectively. The S(Q) profile for the summation of amorphous Si and SiO2 is shown as a blue curve. The dotted line is a guide to the eyes. The weighting factors of Si–Si, Si–O and O–O pairs for X-rays used in the RMC modelling are plotted in Supplementary Fig. 10, together with those for electrons. (b) The schematic diagram of the ABED measurements of amorphous SiO with nanoscale structural heterogeneity. Nano-regions indicated by yellow colour are structurally different from those indicated by blue colour. Diffraction patterns from yellow and blue nano-regions, and also their interface can be acquired by using ABED technique.

