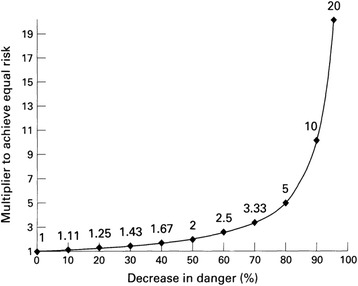
Fig. 1.

The risk/use equilibrium. Each point on this curve indicates the multiplier needed to achieve a constant level of population risk, given specific levels of decreased danger per user. For example, if 100 individuals used a product with full danger (for example, killing 100 % of users), 10 times that number (1000 individuals) would need to use a product that had 90 % decreased danger, to achieve an equal health problem (100 dead in each instance). The formula is Y = 100/100-X, where Y = multiplier and X = decrease in danger, expressed in percentages. If danger is 0.1 %, use would have to increase by 1000 times to produce a problem of the same magnitude as the full risk product (not plotted on figure). For a given risk on the curve, use that is increased by a smaller multiplier represents a public health benefit, and use that is increased by a larger multiplier represents a public health (population level) cost. Figure and legend reproduced from [47] with permission from BMJ Publishing Group Ltd.
