
Fig. 4.
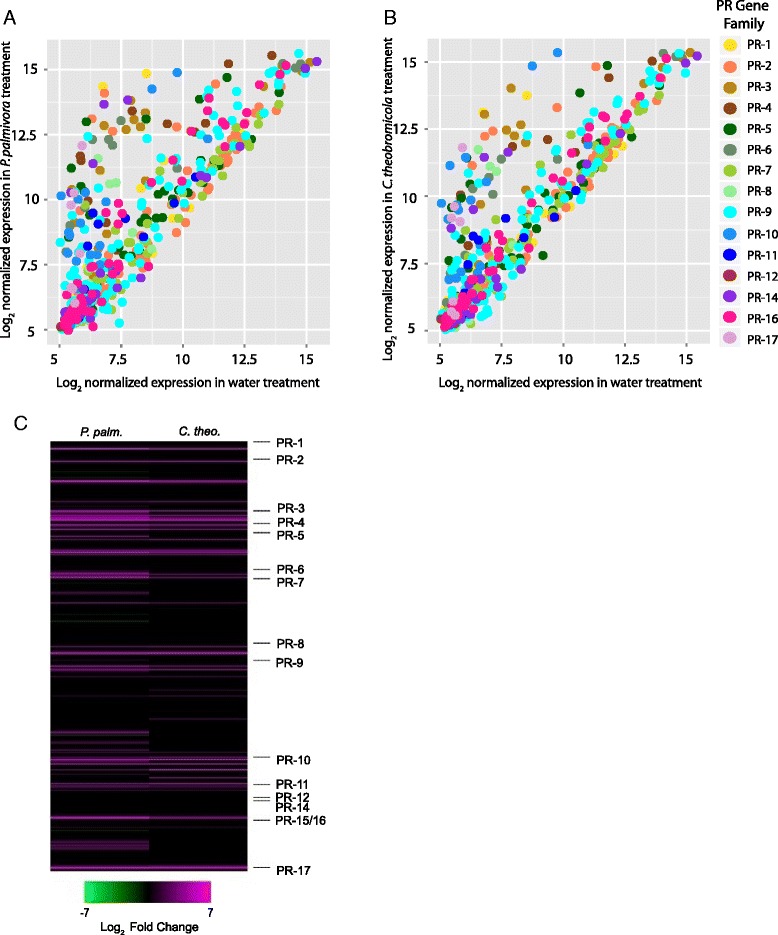
Microarray analysis of pathogen treatment on cacao PR gene expression. Scatterplots of normalized expression value for all probes for PR genes, comparing a P. palmivora treatment and water-treated control and b C. theobromicola with water-treated control. c Heatmap showing fold change in transcript abundance after pathogen treatments compared to water-treated control for all 359 Criollo PR genes. Black bars correspond to genes with non-significant (Benjamini-Hochberg p > 0.05) fold change or genes removed from analysis in background filtration