
Fig. 12.
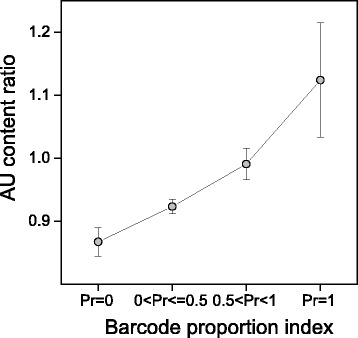
Ratio between A + U occurrence at +1 site and region I in gene categories with increasing breadth of transcription. Transcriptome data were obtained from the Gene Expression Barcode (Barcode) database. Genes were clustered into four categories by proportion of cell types in which a gene was estimated as expressed (Pr). Values represent mean ± SEM