
Fig. 3.
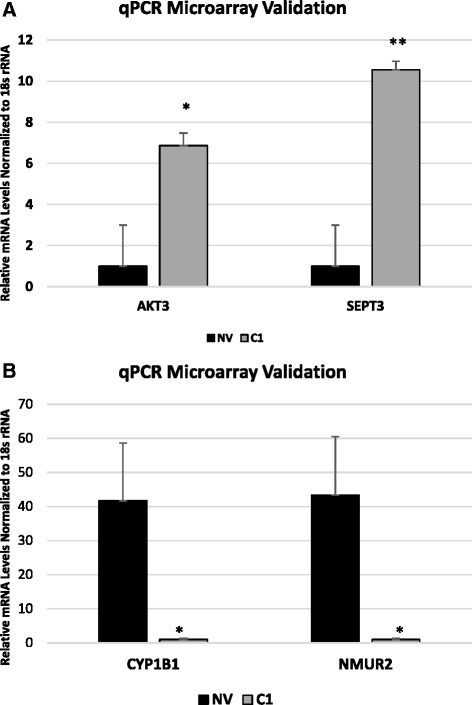
Microarray qPCR validation. AKT3 and SEPT3 (a), and CYP1B1 and NMUR2 (b) were selected to validate microarray results by quantitative RT-PCR. Error bars represent the standard deviation of three biological replicates, *p < .05, **p < .005
Official websites use .gov
A
.gov website belongs to an official
government organization in the United States.
Secure .gov websites use HTTPS
A lock (
) or https:// means you've safely
connected to the .gov website. Share sensitive
information only on official, secure websites.
Microarray qPCR validation. AKT3 and SEPT3 (a), and CYP1B1 and NMUR2 (b) were selected to validate microarray results by quantitative RT-PCR. Error bars represent the standard deviation of three biological replicates, *p < .05, **p < .005