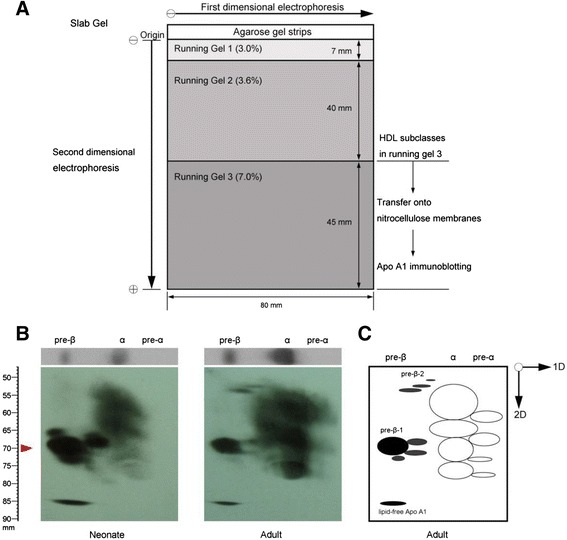
Fig. 2.

Distribution of apoA-I in human serum determined by nondenaturing two-dimensional nonlinear gradient gel electrophoresis. a Schematic diagram of the gel system. b Human serum (4 μl) from each of a neonate and adult was subjected to electrophoresis on a 0.75 % agarose gel (first dimension) for 1 h. The lane was then excised and placed on a nonlinear gradient polyacrylamide slab gel (second dimension) and subjected to electrophoresis for 3 h. Serum proteins were transferred to a nitrocellulose membrane, and human apoA-I was visualized with goat anti-human apoA-I. The red arrowhead indicates the distance of particle migration in the electrophoresis. c Diagram showing HDL subspecies (in adults) isolated by two-dimensional gel electrophoresis
