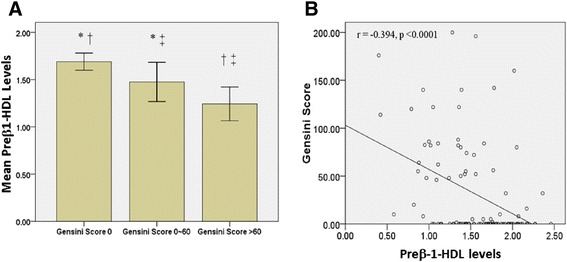
Fig. 7.

Comparisons of preβ1-HDL levels in patients having different Gensini score. a There were 56, 22 and 24 individuals having Gensini score 0, 0 ~ 60 and >60, respectively. Mean preβ1-HDL levels among the 3 groups were significant different by ANOVA test (p < 0.0001). By LSD test, there were significant different preβ1-HDL levels between Gensini score 0 and 0 ~ 60 (* p = 0.0032), 0 and >60 († p <0.0001), and 0 ~ 60 and >60 (‡ p = 0.047). b Univariate linear regression analysis showed a negative correlation between Gensini score and preβ1-HDL levels (r = −0.394, p < 0.0001)
