Fig. 1.

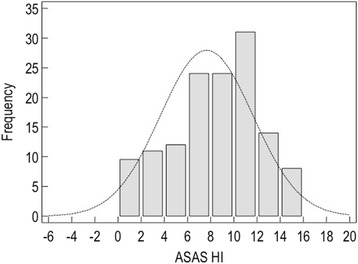
Histograms demonstrating the range and the distribution of ASAS HI questionnaires values. The horizontal axis shows the scores (range 0–17), with high scores indicating a worse health status

Histograms demonstrating the range and the distribution of ASAS HI questionnaires values. The horizontal axis shows the scores (range 0–17), with high scores indicating a worse health status