Fig. 2.

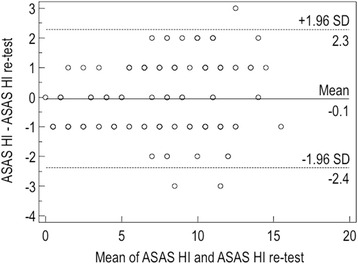
Bland-Altman plot of repeatibility with the differences in ASAS HI values plotted against average values. Ninety-seven percent of the differences against the means were less than two standars deviations (SD; dotted lines)

Bland-Altman plot of repeatibility with the differences in ASAS HI values plotted against average values. Ninety-seven percent of the differences against the means were less than two standars deviations (SD; dotted lines)