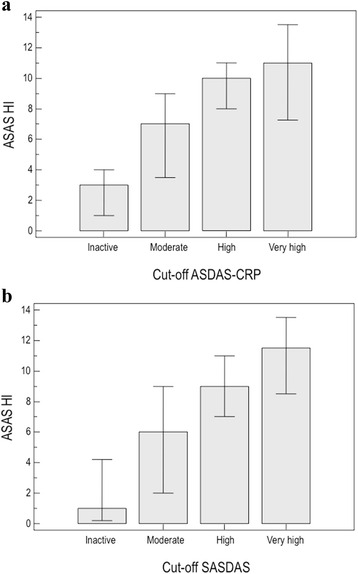
Fig. 3.

Distribution of ASAS HI scores in relation to different ASDAS-CRP (a) and SASDAS (b) cut-off of disease activity. The figure shows the mean values of ASDAS HI on the basis of disease activity cut-off points of ASDAS-CRP (a) and SASDAS (b). The Kruskal-Wallis test was carried out across all four groups (p <0.0001)
