
Fig. 4.
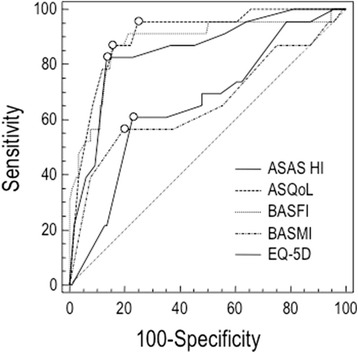
The ROC curves to discriminate the ability of ASAS HI to distinguish patients with active and inactive disease in comparison with anthropometric measures and self-report questionnaires, using ASDAS-CRP as external indicator. The area under the ROC curve (AUC) in this setting can be interpreted as the probability of correctly identifying the improved patients from non-improved. A line that runs diagonally across the figure from lower left to upper right will have an area of 0.5; this represents an instrument that does not discriminate