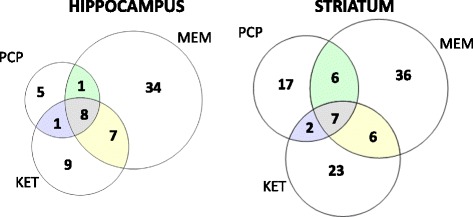
Fig. 2.

Comparison of the number of genes regulated by ketamine, memantine and PCP in the hippocampus and striatum. Venn diagrams show the number and overlap of genes altered by drug treatment in the mouse hippocampus and striatum. Lists of transcripts with statistical significance p < 0.0005 for drug factor after two-way ANOVA in each tissue and absolute fold change greater than 0.3 over saline control (at one of the time points) were analyzed (Additional file 2)
