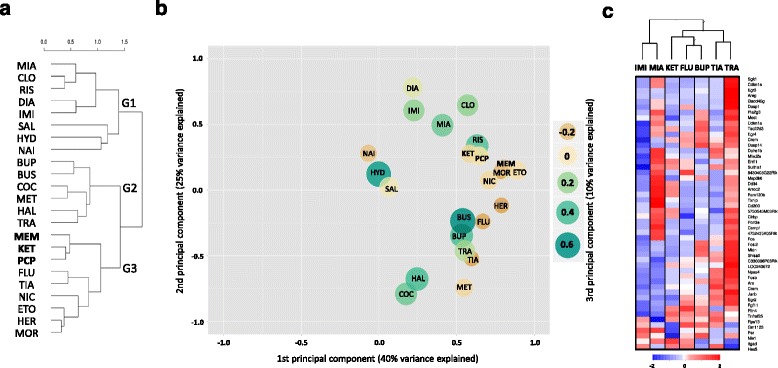
Fig. 3.

Comparison of ketamine, memantine and PCP to other psychotropic drugs based on gene expression patterns in the mouse striatum. Cluster dendrogram (a), PCA plot (b) and heat map (c) were generated based on expression alterations of the top 50 drug-responsive genes found statistically most significant. The gene expression profiles of ketamine (KET), memantine (MEM) and PCP (PCP) were combined with previously published profiles of 18 psychotropic drugs from diverse pharmacological and therapeutic classes: mianserin (MIA), imipramine (IMI), fluoxetine (FLU), bupropion (BUP), tianeptine (TIA), tranylcypromine (TRA), methamphetamine (MET), cocaine (COC), nicotine (NIC), heroin (HER), morphine (MOR), ethanol (ETO), diazepam (DIA), buspirone (BUS), hydroxizine (HYD), clozapine (CLO), risperidone (RIS) and haloperidol (HAL), with saline (SAL) and naive (NAI) groups as the controls [13]. The genes were selected based on ANOVA results for drug factor (top 50) at a threshold of nominal p < 10−26 (after Bonferroni correction p < 10−21). Hierarchical clustering (a) was performed using the measure of Pearson correlation distance and complete distance linkage methods. The PCA plot (b) displays the pattern of similarity between the selected drugs. The first and second components are shown on x and y axis respectively, while the values of the third component are coded by color and size of the circles as indicated on the legend. A comparison of ketamine to antidepressants (c) was based on the patterns of drug-induced transcriptional alterations in the striatum (at 2 h after the treatment). Drug effects were balanced using modified minimum-maximum normalization, where the maximum was set up as average from the top 10 fold changes for every drug. Colored rectangles represent expression levels of the top 50 drug-regulated genes indicated on the right
