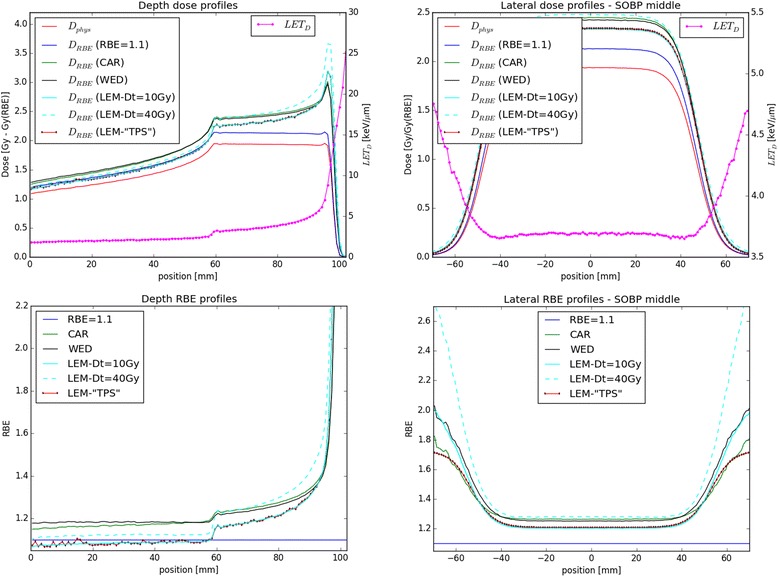
Fig. 4.

Left: D RBE and RBE profiles as function of depth calculated with the three biological models for the (α/β)x = 2 Gy tissue and assuming an RBE of 1.1 are depicted. Dose and LETD values are also shown in the upper panel. Right: lateral DRBE and RBE profiles in the middle of the SOBP for the three biological models for the (α/β)x = 2 Gy tissue are shown together with RBE = 1.1 assumption. LETD values are also shown in the upper panel
