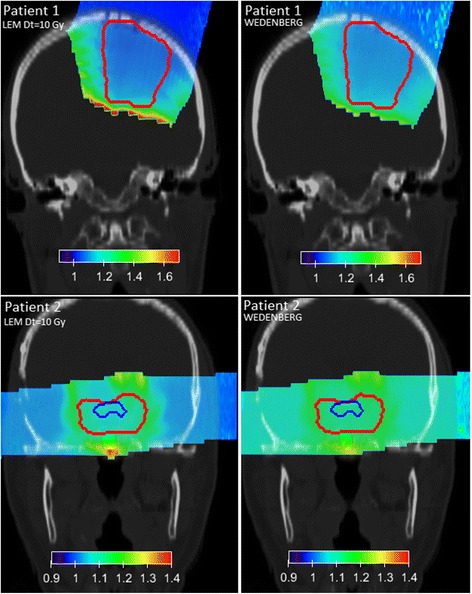
Fig. 7.

RBE distributions for patient 1 (upper panels) and patient 2 (lower panels) are shown for (α/β)x = 10 Gy and variable RBE applying the two biological models (left: LEM, right: Wedenberg). PTV and OAR contours are depicted with lines. The Carabe model is not considered as being outside its range of reliability (cf. Eqs. 14 and 16)
