Fig. 2.

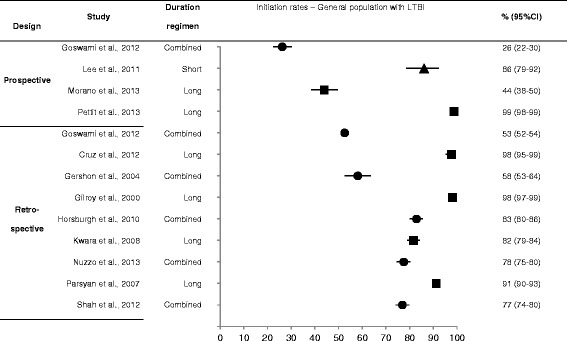
Forest plots with ranges of initiation rates in the general population diagnosed with LTBI. LTBI: latent tuberculosis infection; Circle: combined, square: long, triangle: short

Forest plots with ranges of initiation rates in the general population diagnosed with LTBI. LTBI: latent tuberculosis infection; Circle: combined, square: long, triangle: short