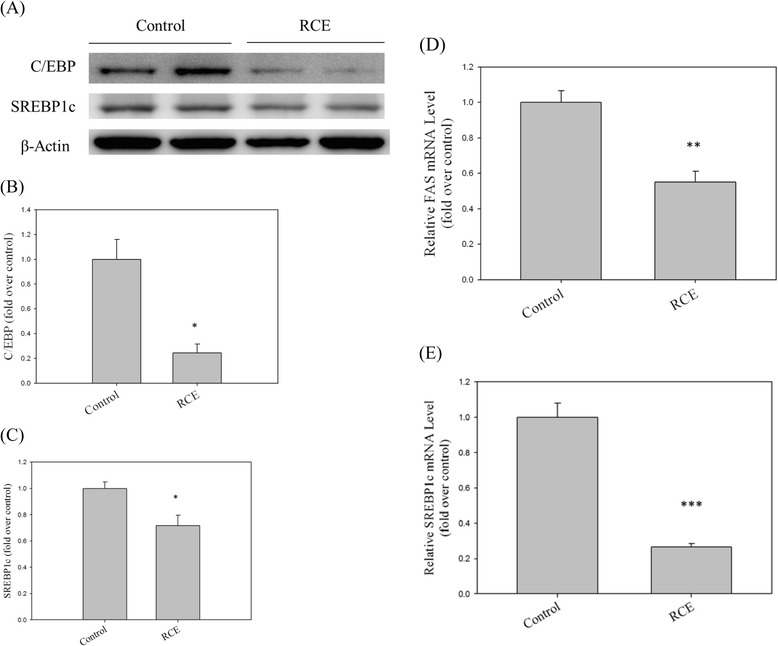
Fig. 5.

Effects of RCE on lipogenic protein and gene expression in rat liver. Protein (a) and gene (d and e) expression levels of C/EBP and SREBP-1c were analyzed by western blotting and Q-PCR, respectively. A quantitative analysis of the protein levels of C/EBP (b) and SREBP-1c (c) was conducted. The results represent the mean ± SEM (n = 3). ∗p < 0.05, ∗∗p < 0.01, and ∗∗∗p < 0.001 vs. the sample without RCE
