Fig. 3.

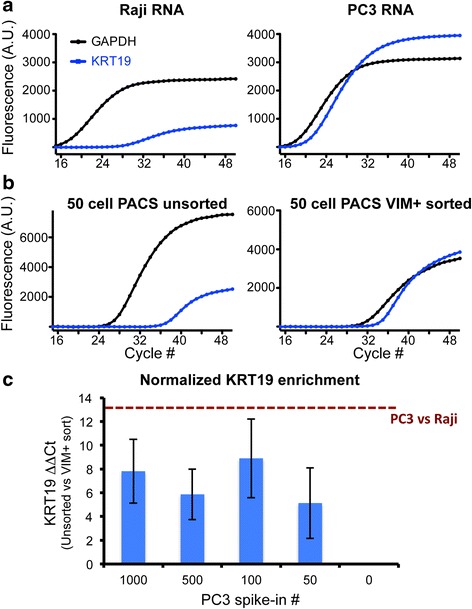
KRT19 expression analysis on PACS-sorted cells. a-b Representative qRT-PCR amplification curves using RNA from pure Raji and PC3 populations (a), or a 50 PC3 cell spike-in unsorted and VIM + −sorted material (b) amplified using TaqMan assays targeting GAPDH and the PC3-specific KRT19 gene. c Relative quantification of KRT19 in VIM + −sorted lysate compared to material from a heterogeneous population across several cell spike-ins shows reliable enrichment in sorted material. Dark red line represents the maximum ΔΔCt KRT19 calculated as the difference in ΔCt values between pure PC3 and Raji populations. Error bars = SEM
