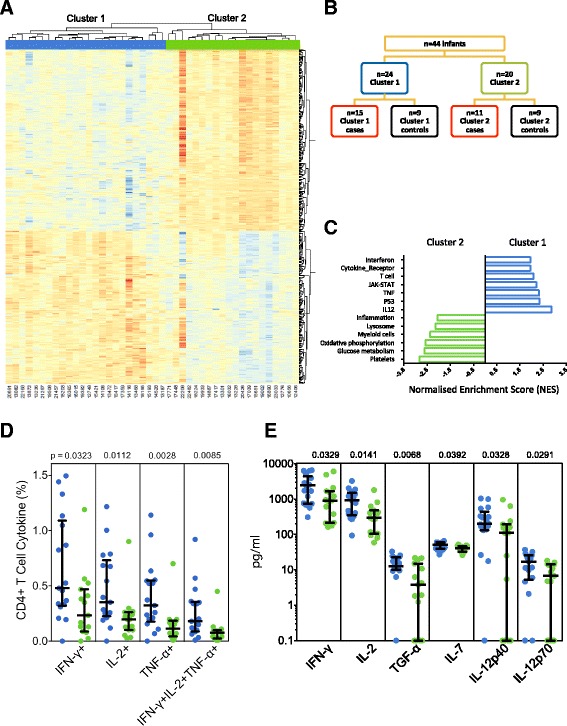
Fig. 2.

Identification of two clusters of gene expression in infants. Samples from the primary cohort of definite cases and household contacts were examined together. a Unsupervised clustering analysis was performed as described in “Methods”, resulting in two major clusters of infants. The heatmap shows results of supervised hierarchical clustering analysis (Pearson correlation), using genes differentially expressed between infants belonging to the two clusters (Additional file 1: Figures S1 and S2); the normalized probe intensity obtained from PBMC stimulated with media only was subtracted from the normalized probe intensity obtained from PBMC stimulated with BCG for 12 h. b Representation of cases and controls among the two clusters. c Gene expression within biological pathways, identified by GSEA, that differed between cluster 1 (blue) and cluster 2 (green). Representative GSEA pathways were ranked by FDR q value (and p value < 0.05). d Frequencies of BCG-specific CD4+ T cells among infants from cluster 1 (blue circles) or cluster 2 (green circles). Antigen-specific cells were identified by cytokine expression following incubation of whole blood with BCG for 12 h. Bars depict medians and IQR; the Mann–Whitney U test was used to assess differences. e Quantification of molecules released in whole blood after a 7-h incubation with BCG. BCG-specific levels were calculated by subtracting levels in plasma from whole blood incubated with costimulatory antibodies alone from those in BCG-stimulated blood. Bars depict medians and IQR; the Mann–Whitney U test was used to assess differences
