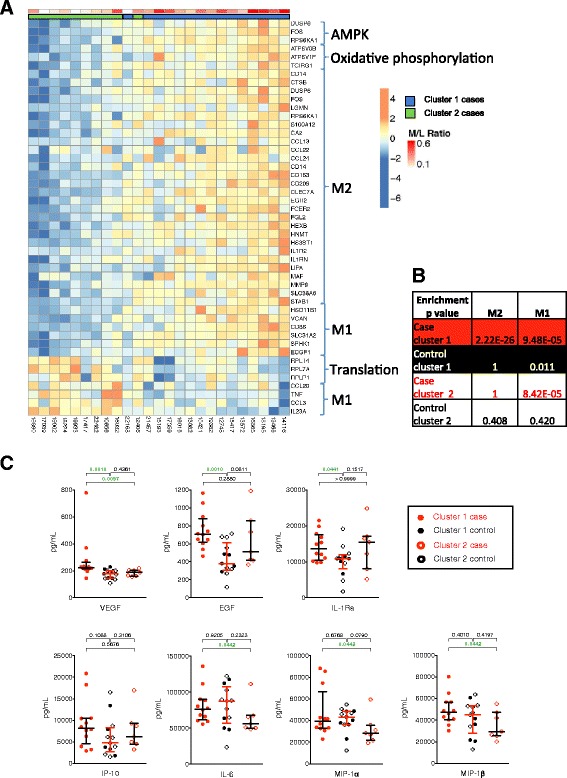
Fig. 5.

Evidence of differential M1 and M2 monocyte activation in cases and controls from different clusters. Samples from the primary cohort were analyzed. a Heatmap showing genes associated with AMPK, oxidative phosphorylation, translation, M1 monocytes and M2 monocytes, which were differentially expressed between cluster 1 cases and the three other groups, or cluster 2 cases and the three other groups. Cases from clusters 1 and 2 are shown. To build the heatmap, the infants were first ranked by increasing expression intensity for each gene. Then, the mean-rank, across the set of genes, for each infant was used to order infants from the lowest to the highest mean-rank. A Spearman correlation was used to assess the significance (p value < 0.0008) of the association between the ordering of the infants and the monocyte to T cell ratio. b The p value table from an over-representation test performed using Fisher’s exact test to identify M1 (right column) and M2 (left column) gene signature enrichment amongst up-regulated in each of the four groups of infants. (c) Concentrations of pro- and anti-inflammatory molecules were measured by Luminex in plasma from whole blood stimulated with BCG for 7 h. Bars depict medians and IQR; the Mann–Whitney test was used to assess differences in all analyses
