Fig. 5.

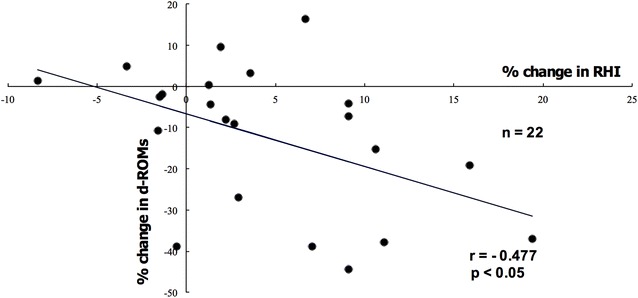
Correlation between percent change in RHI and percent change in d-ROMs in the teneligliptin group. The percent change in RHI strongly and negatively correlated with the percent change in d-ROMs in the teneligliptin group (n = 22)

Correlation between percent change in RHI and percent change in d-ROMs in the teneligliptin group. The percent change in RHI strongly and negatively correlated with the percent change in d-ROMs in the teneligliptin group (n = 22)