
Fig. 5.
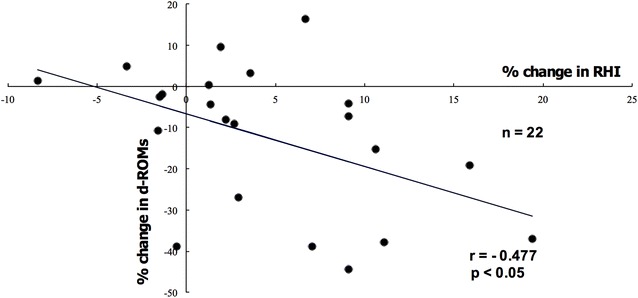
Correlation between percent change in RHI and percent change in d-ROMs in the teneligliptin group. The percent change in RHI strongly and negatively correlated with the percent change in d-ROMs in the teneligliptin group (n = 22)
Official websites use .gov
A
.gov website belongs to an official
government organization in the United States.
Secure .gov websites use HTTPS
A lock (
) or https:// means you've safely
connected to the .gov website. Share sensitive
information only on official, secure websites.
Correlation between percent change in RHI and percent change in d-ROMs in the teneligliptin group. The percent change in RHI strongly and negatively correlated with the percent change in d-ROMs in the teneligliptin group (n = 22)