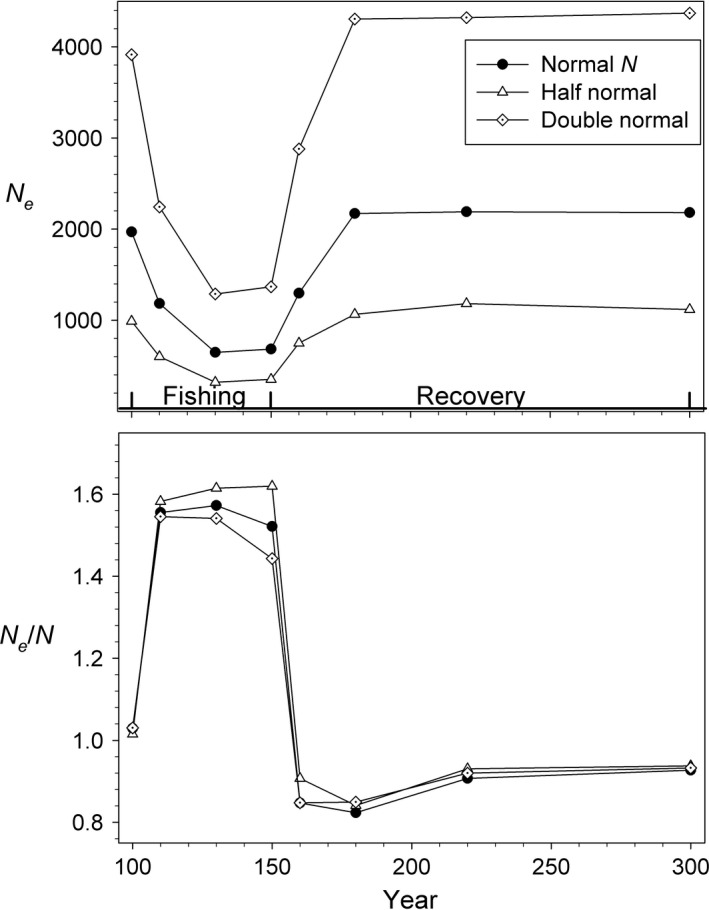
Figure 4.

Effects of varying initial population size for simulated cod populations. Results are for selective fishing at F = 0.2 with evolution. The filled circles (Normal N) reproduce results for F = 0.2 shown in Fig. 3; the other lines and symbols show results for scenarios in which initial size was half or double the ‘Normal’ level.
