Fig. 3.
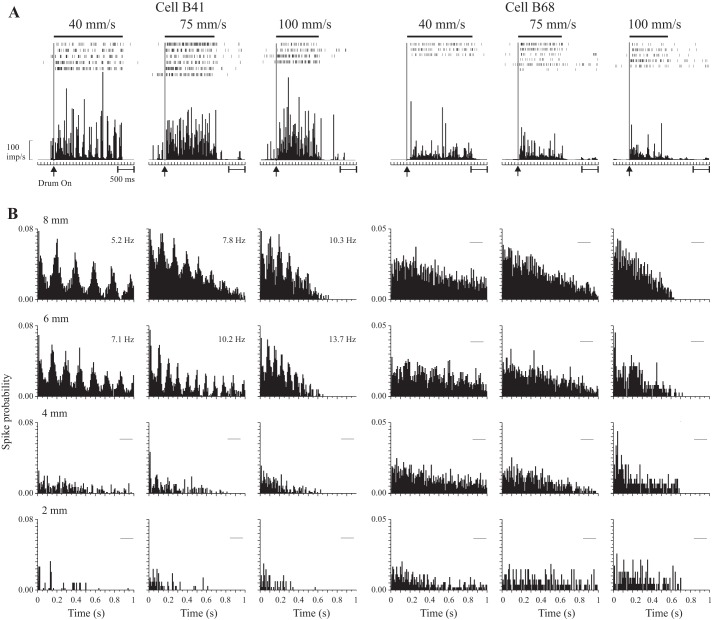
A: post-event histograms (PEH; bin width, 25 ms) showed evidence for periodicity for some texture-related cells (left), but not others (right). Data are aligned on the onset of drum rotation; the bar (above) shows the approximate duration of the drum scan. B: autocorrelogram histograms for the same two cells (bin width, 8 ms) for each SP and speed tested. Cell B41 (left) displayed periodic discharge for rough surfaces (SPs of 6 and 8 mm), all 3 speeds tested, but not for smoother surfaces (2 and 4 mm SP). Cell B68 (right) showed no periodic discharge for any of the 12 conditions tested. For these examples, the autocorrelograms were based on all spikes recorded during the period of drum rotation. For cell B41, the measures of the temporal frequency of discharge (based on the peak timing of single peaks that exceeded baseline by 1 SD; Lebedev and Wise 2000) are given in each panel.

