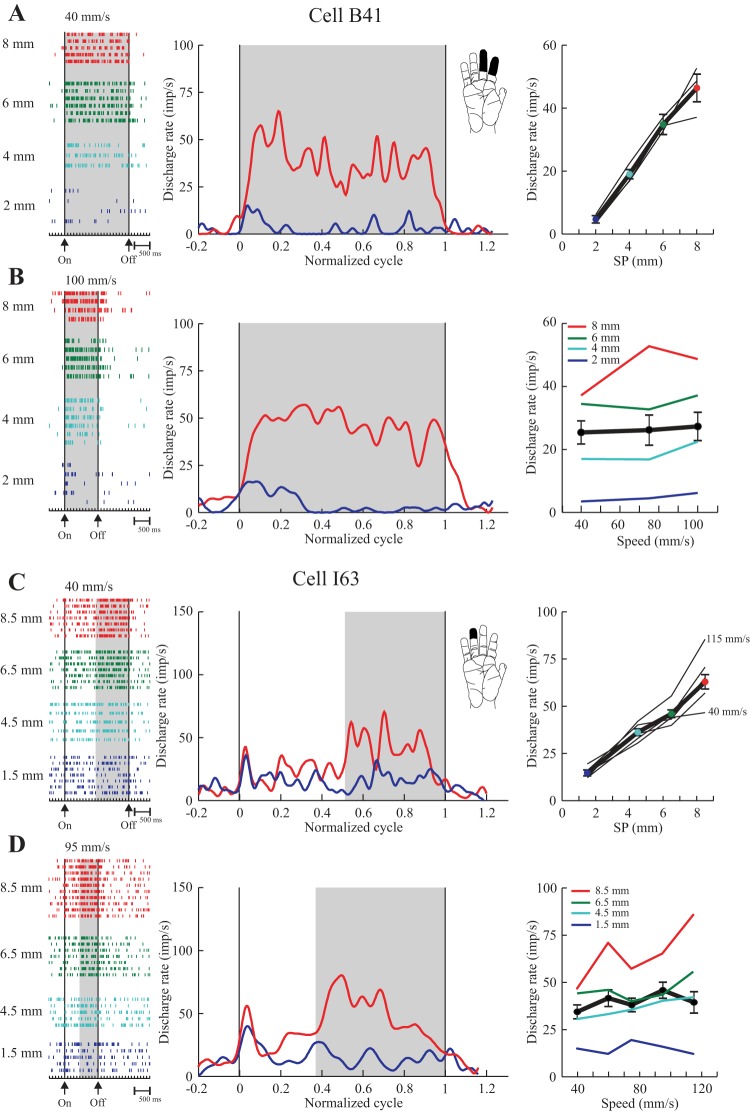
Fig. 4.
Examples of two texture-only cells (area 3b) that showed a monotonic increase in discharge as SP was increased (graded). A and B: cell tested with series P2 (2–8 mm SP; same cell as in Fig. 3, left). C and D: cell tested with series P1b (1.5–8.5 mm SP), with modified SP only over the second half of the surfaces (shaded region). For each cell, rasters (left) show data from individual trials aligned on drum onset (first vertical line, On). Drum stop is indicated by the second vertical line (Off). Trials are sorted according to SP and scanning speed (A and C, slow; B and D, fast). During acquisition, the surface and speed changed on a trial-by-trial basis. Discharge rate is shown in PEHs (middle), normalized to the duration of the surface scan (data during surface presentation divided into 256 equal bins, see Drew and Doucet 1991; Udo et al. 1982) so as to show data from low (A and C) and high (B and D) speeds on the same relative time scale. Baseline discharge is also shown (±20% of the duration of each scan, assigned to 12 bins pre- and 12 bins postscan). Discharge was convolved with a Gaussian (Gaussian standard deviation, 35.4 ms). PEHs are shown for the smoothest (blue) and roughest (red) surfaces. Summary plots (right) show mean discharge frequency as a function of SP (A and C) and scanning speed (B and D). The thick line is the mean across all trials (±SE). The thin lines show the individual plots for each SP (A and C) or speed (B and D). Scanning speed had little effect on the pattern of discharge so that the graded pattern was preserved across the range of speeds tested. These cells were both sensitive to light touch [see inset; A and B, rapidly adapting (RA); C and D, slowly adapting (SA)].

