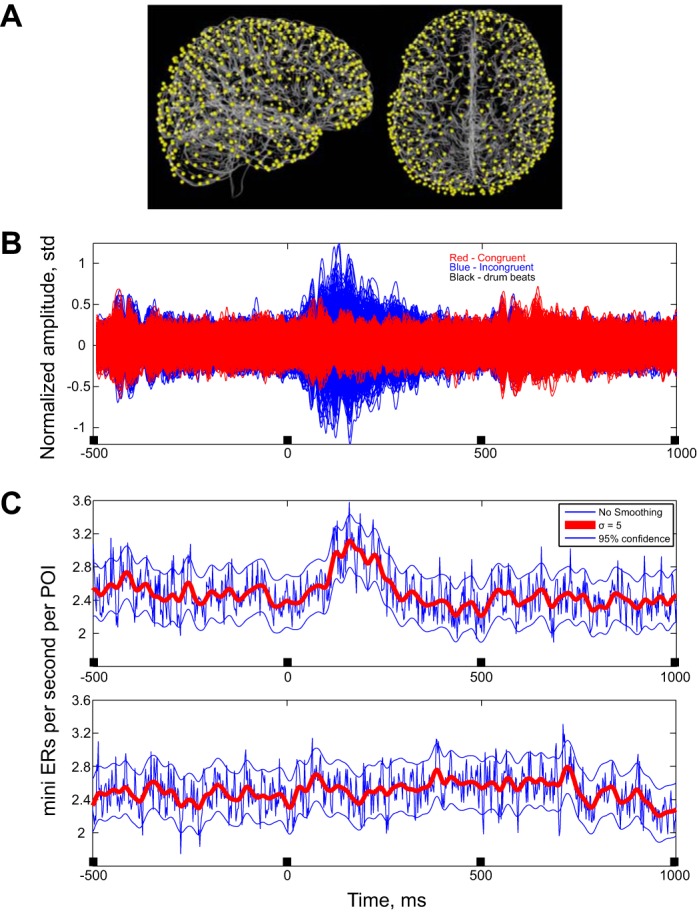
Fig. 3.

Average activities. A: anatomical locations of POIs. The cortical surface of a single subject is shown in sagittal and axial views. The surface was created using FreeSurfer and overlaid by the locations of the POIs contributing to the pattern density. B: CCDs in the congruent and incongruent cases. All the CCDs were filtered at 8–60 Hz and then averaged around the beat. Amplitudes of the CCDs were normalized to have 0 mean and a variance of 1. Blue (amplitude around the incongruent beat) averages are large even compared with the ongoing background activity. Red traces indicate amplitude around the last congruent beat. The red traces are plotted over the blue ones. C: mean rate for the mini ERs on all channels for the incongruent case (top) and for the congruent case (bottom). Blue traces indicate mean rate with a maximal time resolution (∼2 ms). Red traces indicate rate after smoothing with a Gaussian bell with a standard deviation of 5 ms. Black marks on the X-axis indicate the drum beat times.
