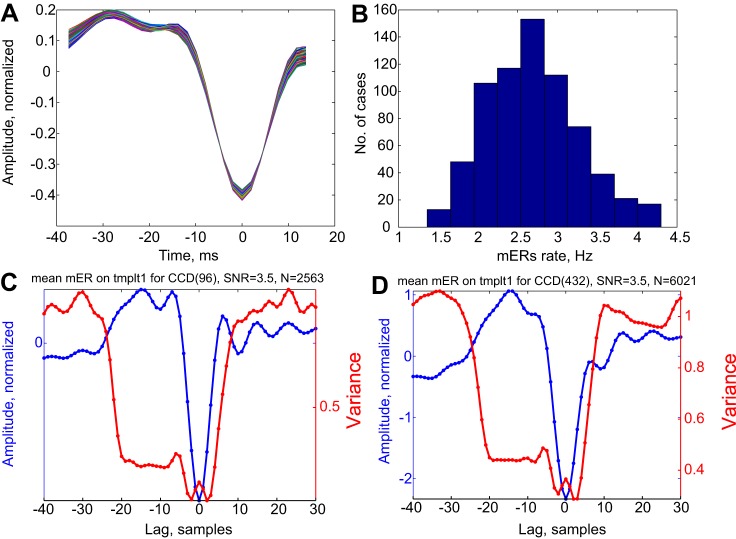
Fig. 4.
Properties of mini ERs. A: superposition of 700 templates to detect mini ERs. Each template was normalized to have 0 mean and a norm of 1. Colors were added to facilitate discrimination between traces. B: distribution of mini ER rates across the different CCDs. C and D: CCDs were filtered at 8 to 60 Hz, and the mean wave shape around the time of mini ER detection was computed. Examples of mean mini ER and the variance around them are shown. The variance corresponds to the dispersion of current source density about the mean as a function of time after time-locking to mini ERs. Note that in contrast to what is usually observed for averaged responses, the variance drops precipitously for the duration of the template (lag: −21 to 5 samples.). Note that the variance is ∼1, and therefore the standard error of the mean is less than 0.02 for both C and D, whereas the scale for the mean spans ∼3 standard deviations. Plotting such a band around the mean would not leave room for the mean itself to be seen. The sampling rate was 508.36 Hz, so the interval between samples was ∼2 ms. mER, mini evoked responses; SNR, signal-to-noise ratio; templt1, template.

