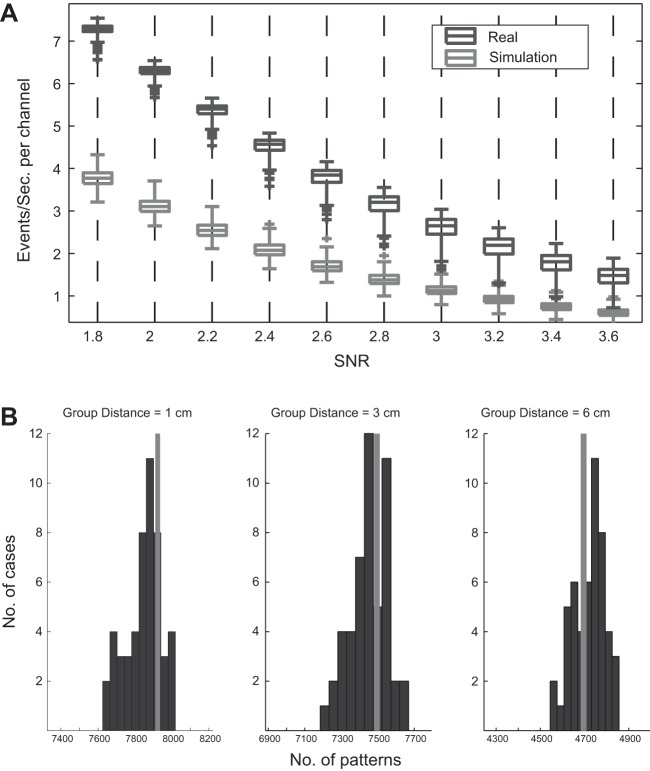
Fig. 7.
Number of events and patterns for the simulated data. A: number of mini ERs as a function of the SNR threshold for detection in the real MEG data for a representative subject (black) and in the simulation (gray). The boxes show the 1st and 3rd quartiles of the mini ER rate across channels (with the median, minimum, and maximum). Outliers (over ±3 SD) are marked by a plus sign (+). B: histograms indicate the total number of patterns found in 50 teeterings. Gray bar indicates the number of patterns in the data before teetering. Both the real numbers and the teetered numbers are based on reducing the events so that any synchronous group could be split into groups with a diameter <1, 3, or 6 cm and intergroup distances >1, 3, or 6 cm, respectively. In the simulated data, teetering within ±1 samples did not affect the number of patterns in the simulated data.

