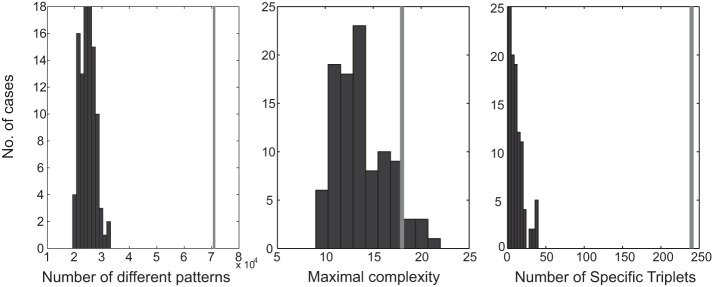
Fig. 8.
Distribution of parameters for the scrambled incongruent beats. Black bars represent the distribution in 100 scrambled pieces. Gray bars indicate the value in the real data. Left, the number of different repeating patterns starting with quintuplets. Middle, the length of the patterns with the maximal number of events. Right, the number of triplets that repeated many times in congruent beats and never or only a few times in the incongruent beats, where the difference had a surprise of 6 or more.

