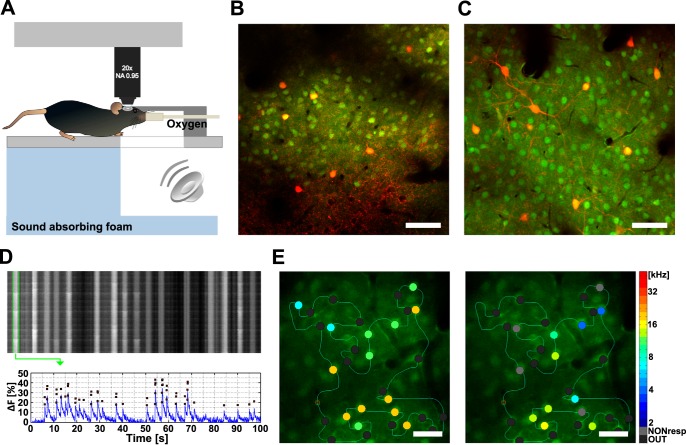
Fig. 3.
Calcium imaging in the primary auditory cortex (AC) in vivo. A: experimental layout of free-field acoustic stimulation under 2-photon microscope. B: example field of view (FOV) of layer (L)2/3 in the right AC in vivo in a PV-Cre/tdT mouse. Parvalbumin-positive (PV+) cells are in red. C: similar FOV in a SST-Cre/tdT mouse with red somatostatin-positive (SST+) interneurons. Cells in B and C were loaded with Oregon Green 488 BAPTA-1 (OGB-1 AM, green); scale bars, 50 μm. D, top: example line scan data. Rows correspond to sequential scans through a custom-defined line scan trajectory. Vertical stripes correspond to individual neurons. Bottom: fluorescence trace of the neuron corresponding to the first vertical stripe was processed and plotted (blue) together with positions of putative action potentials (red squares) obtained by using a peeling algorithm. E: line-scanned neurons before and after the AAT. Identified neurons (circles) were color-coded according to their best frequency (BF). Gray circles represent neurons that did not respond significantly to sounds (NONresp); black circles represent out-of-plane neurons (OUT). Scale bars, 25 μm.

