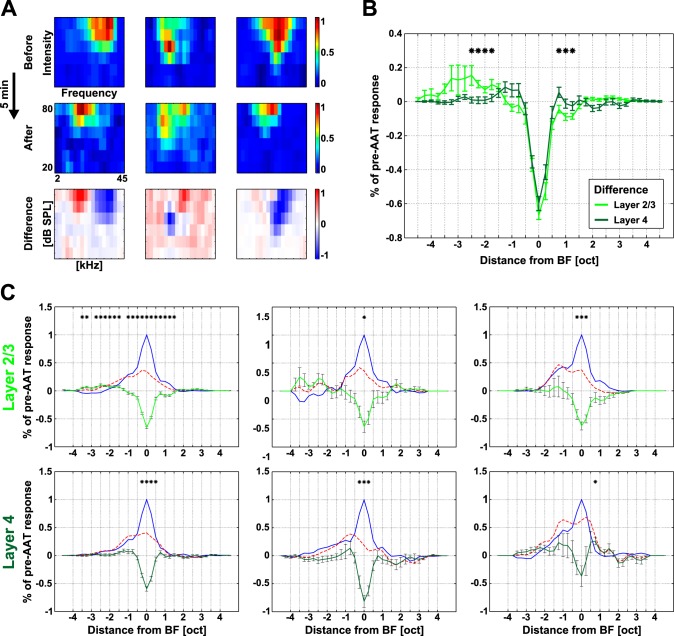
Fig. 5.
Frequency tuning changes in the AC after AAT. A: example receptive fields (RFs) before and after AAT: disinhibition at lower frequencies (left), disinhibition at higher frequencies (center), and no clear disinhibition (right). RFs became smaller in all 3 cases. B: mean difference in tuning curves before and after the AAT for L2/3 and L4 neurons. C: average pre-AAT tuning curves (blue), post-AAT tuning curves (dashed red), and differential curves (green) for both layers and 3 classes of neurons; Bonferroni correction for multiple comparisons. *P < 0.0014, Wilcoxon rank sum test (B) or Wilcoxon signed-rank test (C).

