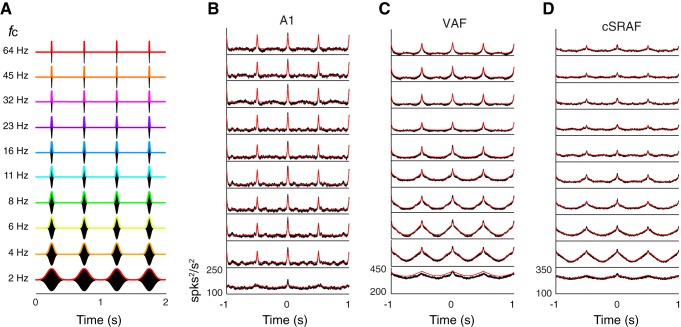
Fig. 6.
Population SACs follow the sound envelope in A1, VAF, and cSRAF. A: 10 different sound waveforms with varying fc from 2 to 64 Hz. B–D: population SACs (black lines) and fits (red lines) for A1 (B), VAF (C), and cSRAF (D). Sound waveform delivered to obtain averaged SACs are shown in corresponding row in A.

