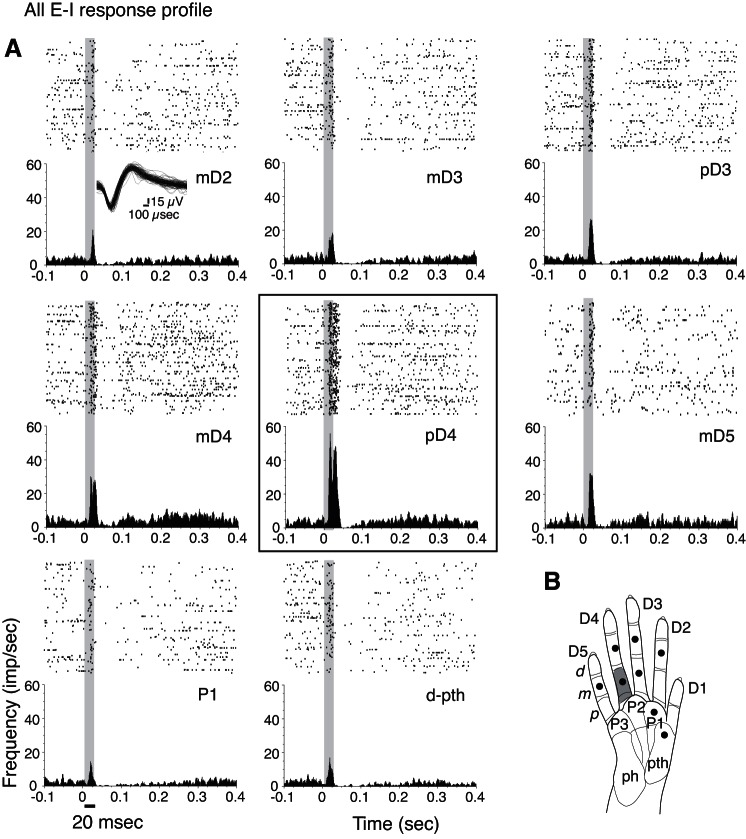
Fig. 9.
A: example of excitatory responses followed by postexcitatory suppression to single-site stimulations on several hand sites within 1 recording session, making up an “All E-I” response profile for a unit (16a) from squirrel monkey SM-A. Waveforms of unit 16a, recorded during single-site stimulation, are shown in the inset (top left). B: gray shading on hand schematic indicates the hot spot in which tactile stimulation on pD4 evoked the highest firing rates (corresponding to the black box around the PSTH and raster in A) compared with the other sites tested in the recording session. Note that in contrast with the complex response profile (Figs. 7 and 8), this All E-I response profile does not include I responses alone for any of the tested stimulation sites. Filled circles in hand schematic mark stimulation locations.

