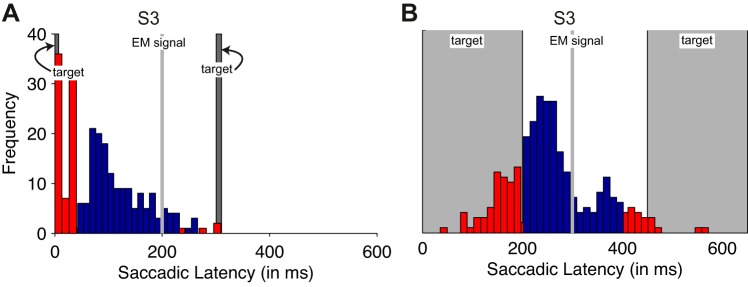
Fig. 5.
Saccade timings for the auditory saccade condition (A) and the visual saccade condition (B) for subject S3.The critical saccade is plotted relative to the first of the 2 apparent motion stimuli (but note that the saccades were executed relative to the saccade signal). The dark gray rectangle on the left shows the onset and duration of the presaccadic probe, and the rectangle on the right for the postsaccadic probe. Blue bars are included eye movements; red bars are excluded eye movements. EM signal,

