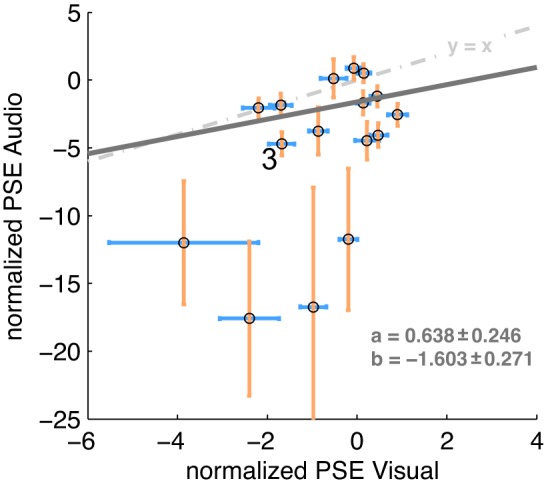
Fig. 6.

Cross-modal relationship for the normalized PSEs, where each point reflects the normalized PSE (fixation-saccade) for 1 subject in the auditory (y-axis) and visual (x-axis) condition. Error bars are SE for visual and audio PSEs for each respective subject. The dark gray line shows the weighted linear regressions, and the slope a and intercept b for the regression are shown (means ± SE). The light gray dashed line shows the identity relationship between x and y. Note that the axis scales differ between x and y. 3 indicates data for sample subject S3. Refer to text for further details.
