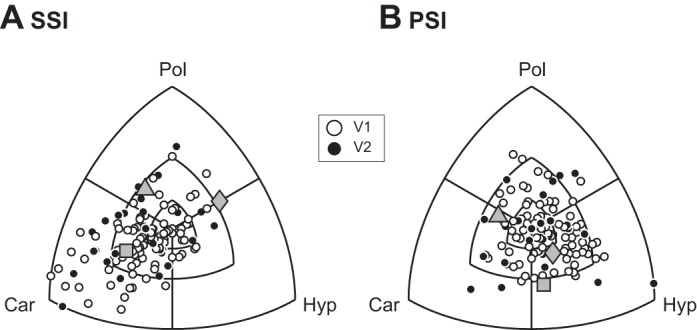
Fig. 3.

Distribution of SSI (A) and PSI (B) values for both V1 and V2 are shown on a triple-axis plot, which displays the differences in tuning index between grating classes. Concentric parallels mark the 0.1, 0.25, and 0.5 differences in tuning indexes between grating classes. Gray symbols (triangle, square, and diamond) refer to the neurons in Fig. 2B.
