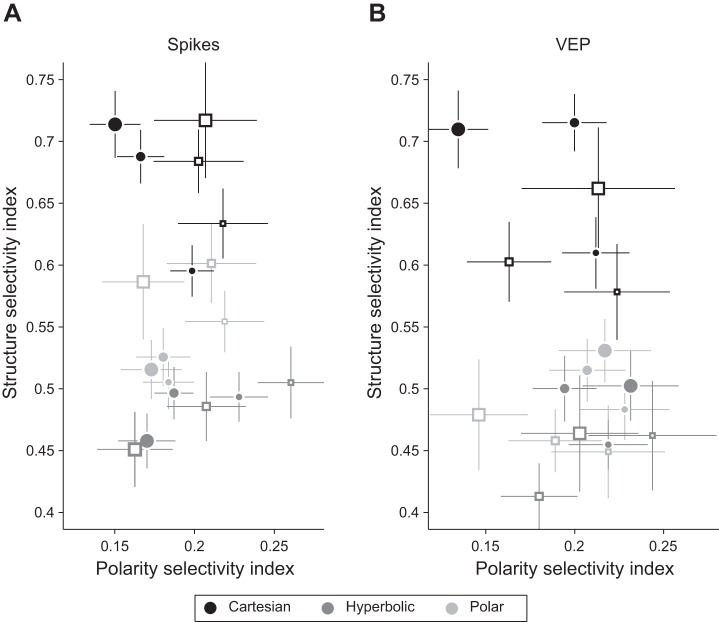
Fig. 4.
Average SSI and PSI estimated by spiking responses (A) and visually evoked potentials (VEPs; B) are shown for all experimental conditions: grating classes are marked by different shading as indicated at bottom; stimulus sizes 1, 2, and 4 are displayed as symbols of 3 different sizes; V1 and V2 are marked by filled and open symbols, respectively. Vertical and horizontal lines are SEs of mean SSI and PSI values, respectively.

