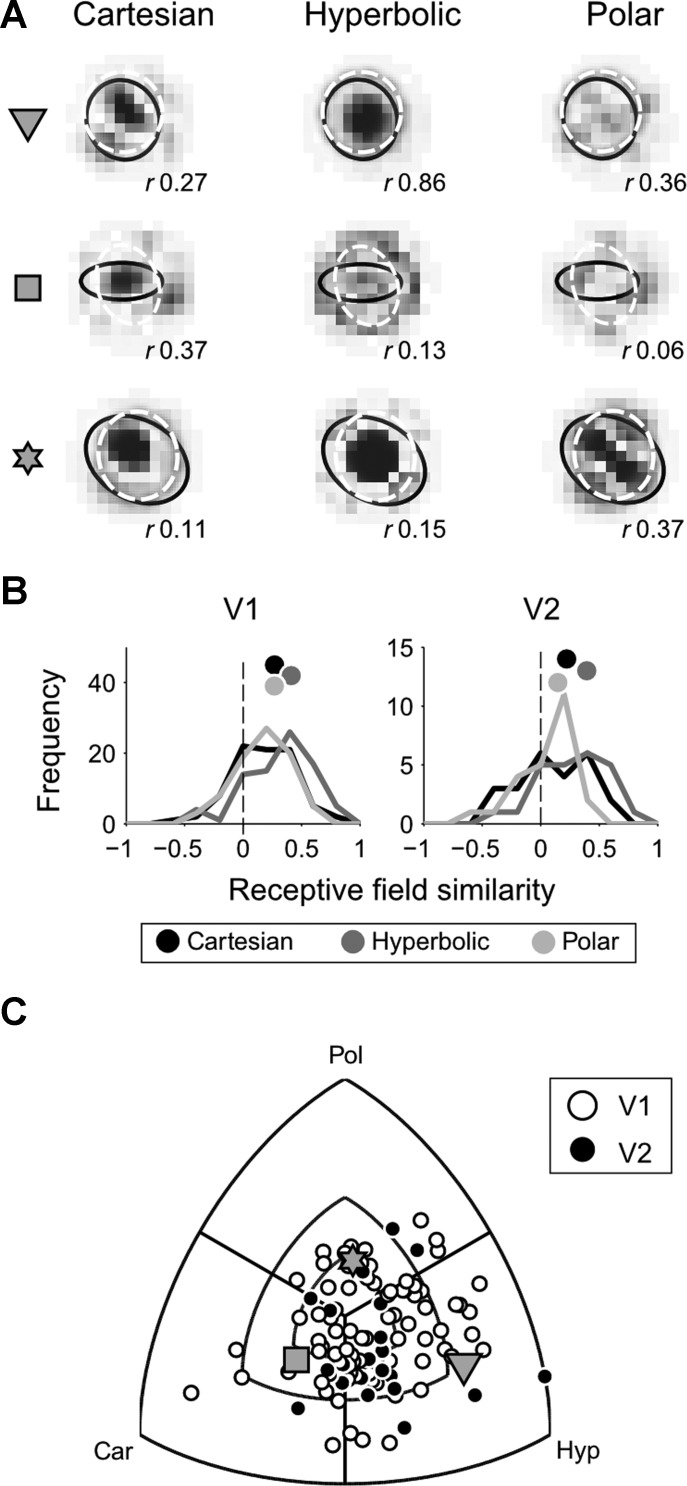
Fig. 8.
Receptive field similarity (RFS). A: RFs of 3 exemplar neurons are displayed after reconstruction by reverse correlation with grating stimuli of the Cartesian (left), hyperbolic (center), and polar (right) grating classes. For each new stimulus, white and black pixels are equivalent to light and dark stimulus patches, respectively. Overlaid ellipses show the ON and OFF RF subregions as computed using the sparse noise technique. The correlation between the sparse noise stimulus map and grating stimulus map was computed by 2-dimensional correlation of the 2 maps, and resulting values (r) are shown at bottom right corner of each map. Gray symbols at far left mark the 3 exemplar neurons in C. B: histogram of RFS indexes at stimulus size 1. C: RFS for V1 and V2 neurons is displayed on a triple-axis plot that shows the relative difference between grating classes. Concentric parallels mark the 0.25, 0.50, and 1.0 difference in RFS between grating classes. Gray symbols refer to the 3 neurons marked in A.

