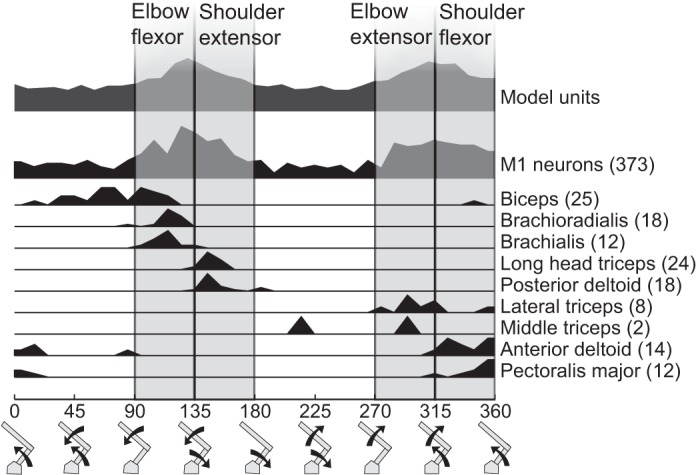
Fig. 5.

Distribution of load preferences for M1 neurons and individual muscles. The number of recordings for each muscle is indicated in parentheses beside the muscle name. The 4 assigned motor fields are shown as vertical shaded stripes with their titles marked at top.
