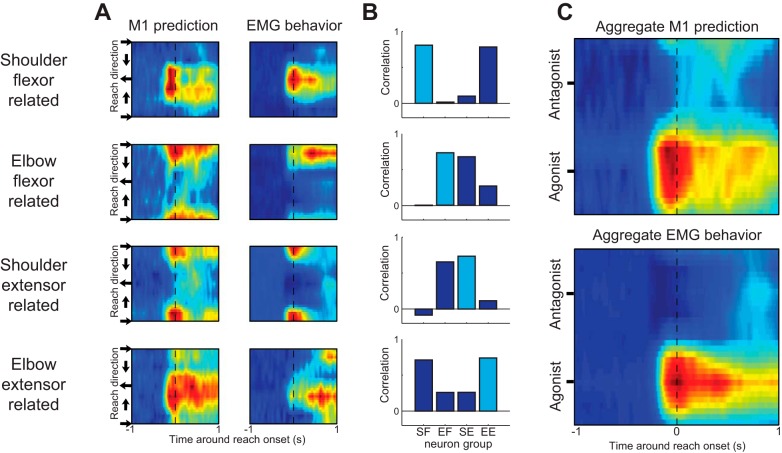
Fig. 7.
Spatiotemporal dynamics of muscle groups and associated M1 neuron populations during reaching. A: color maps of the aggregate activity over time (x-axis) and across reach direction (y-axis) of each muscle group and associated population of M1 neurons. Data are smoothed in the y-axis for display purposes. B: 2-dimensional correlation coefficients between the spatiotemporal patterns of muscle and neuron groups. Each graph is 1 muscle group, and the bars show the coefficients between that muscle's spatiotemporal pattern and the pattern of the 4 populations of M1 neurons. C: aggregate activity of all neurons and all muscles were generated by rotating the y-axis of each group so that their directions of maximal agonist activity were aligned with the agonist direction and then averaged.

