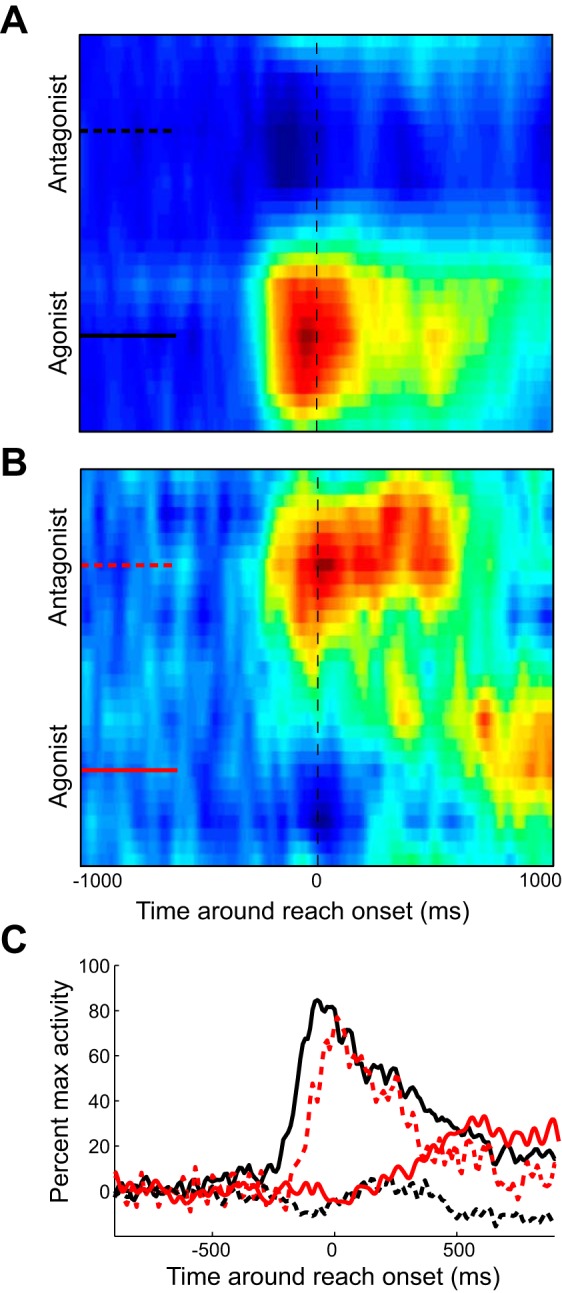
Fig. 8.

Aggregate spatiotemporal color maps of M1 neurons that have similar and opposing PRDs compared with their associated muscle group. A: color map of population activity of all neurons whose PRD was within 30° of its assigned muscle group (typical neurons). Aggregate of neural activity was rotated as in Fig. 7. B: color map of population activity of all neurons whose PRD was >150° away from that of its assigned muscle group (atypical neurons). C: spatiotemporal pattern of activation for typical (black lines) and atypical (red lines) neurons when the muscle group acts as an agonist (solid lines) or an antagonist (dashed lines).
