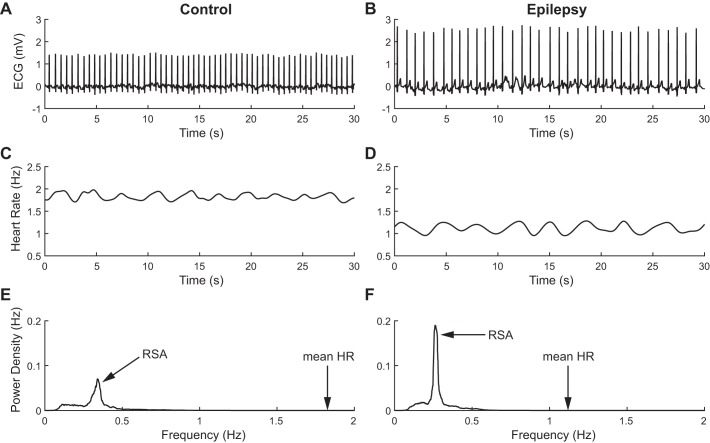
Fig. 1.
Heart rate variability (HRV) in representative control (left) and epilepsy (right) subjects. A and B: raw ECG traces over periods of 30 s; decreased HR is readily apparent in the subject with epilepsy. C and D: instantaneous HR over the same 30-s periods as in A and B; lower baseline and increased variability are visible in the patient with epilepsy. E and F: power spectral densities of HR over a 30-min period, filtered above 0.1 Hz; high-frequency modulation of HR, corresponding to respiratory sinus arrhythmia (RSA), is enhanced in epilepsy.

