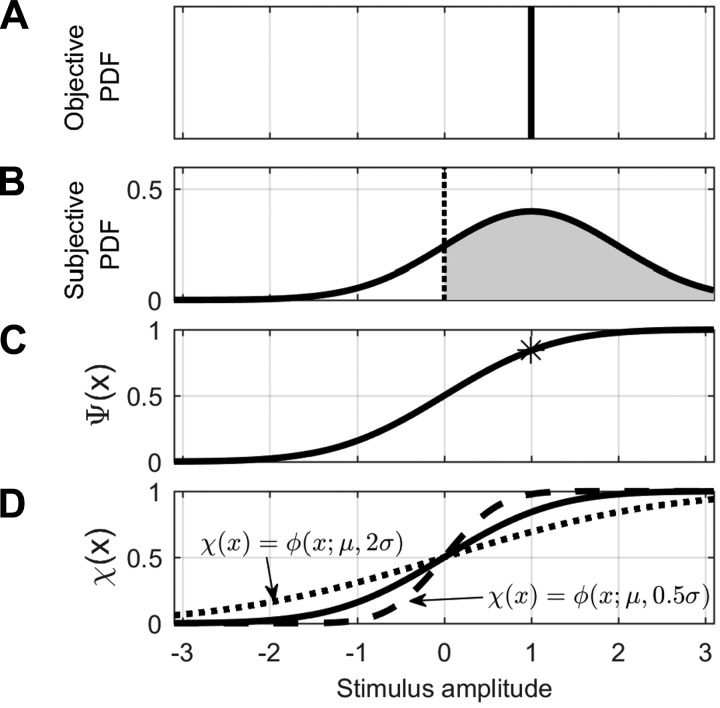
Fig. 1.
Relationship among decision variables, psychometric functions [Ψ(x)], and confidence functions [χ(x)] in our confidence signal detection (CSD) model. A: The stimulus for this example is well controlled having an amplitude of +1.0 with little variation, so the objective probability density function (PDF) is a delta function. B: signal detection model assumes additive noise. For this example, Gaussian noise having zero-mean and a SD of 1 is added to the stimulus of +1.0 and leads to the subjective PDF shown. The dotted vertical line at zero represents a decision boundary. If a sampled decision variable falls to the right of the decision boundary, represented by the gray area, the subject decides positive. If the sampled decision variable falls to the left, the subject decides negative. For this example, 84% of the decision variables lead to the subject deciding positive. C: asterisk located at (1, 0.84) represents the example data point illustrated in the previous panel. When this process is repeated for a variety of different stimulus levels, it yields a psychometric function, Ψ(x) (black curve). D: similarly, a relationship between confidence and the stimulus for an individual trial can be represented by a confidence function [χ(x)]. The psychometric function represents average subject performance, and confidence is defined as well calibrated when confidence matches average subject performance (Bjorkman et al. 1993; Ferrell 1995; Keren 1991; Lichtenstein et al. 1982; Stankov et al. 2012). Therefore, well-calibrated confidence matches the psychometric function [χ(x) = Ψ(x)] and is plotted as the solid curve. Also shown are confidence functions that represent overconfidence (dashed) and underconfidence (dotted).

